Who We

Serve

I-Maps Clients

Asset Managers

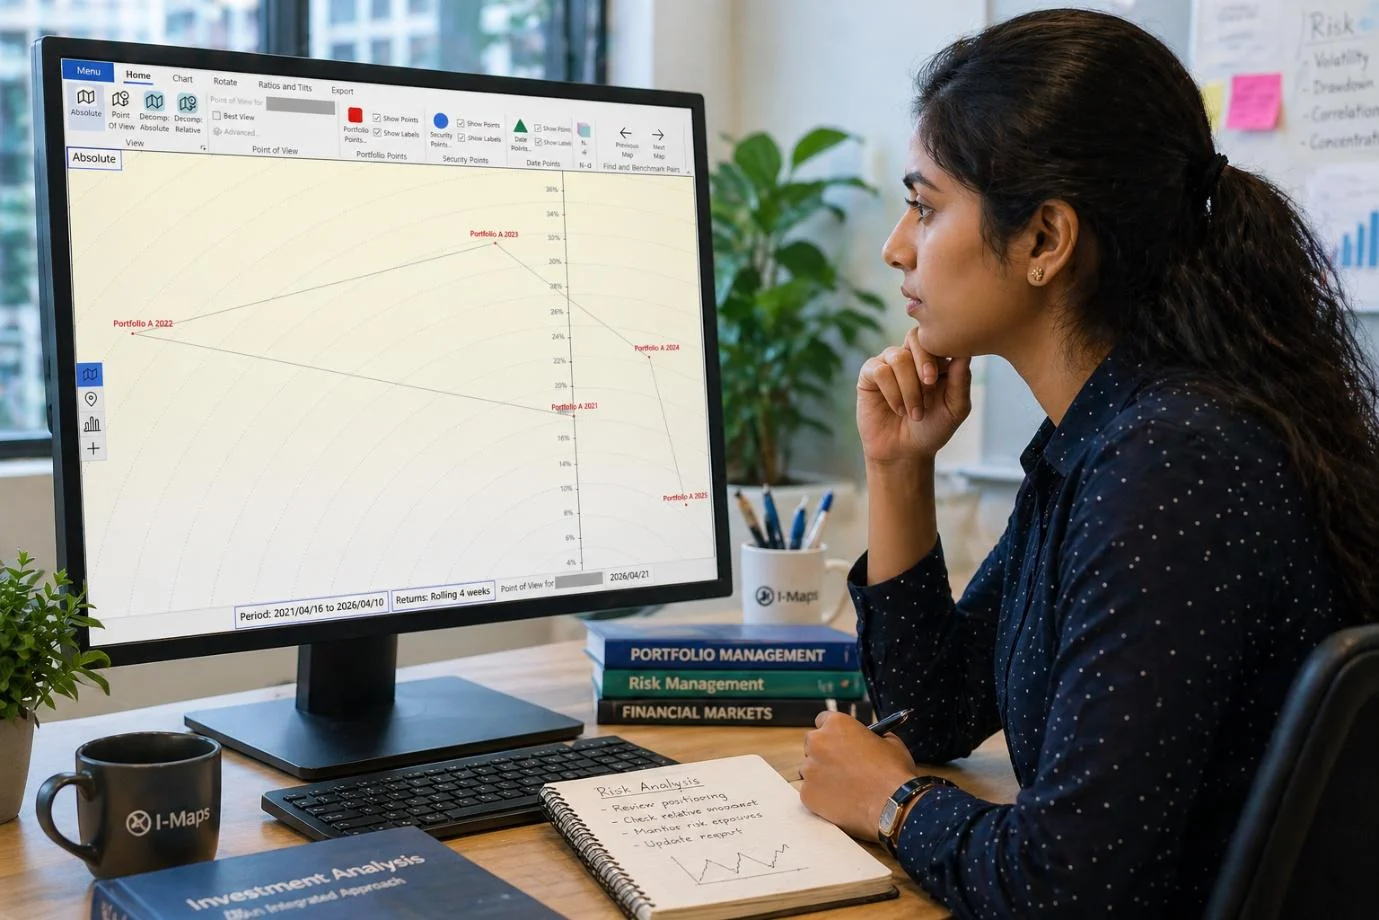
I-Maps equips fund managers with powerful visualisation and analytics tools to understand portfolio positioning, manage risk, and support data-driven decisions. The platform makes it easier to assess exposures, compare strategies, monitor risk drivers, and communicate portfolio intent across internal teams and external stakeholders.

  • Visualise the investment landscape and portfolio positions clearly.
  • Test allocations using what-if trade scenarios before execution, helping validate decisions before they are implemented.
  • Identify diversification gaps and risk concentrations at a glance, supporting stronger portfolio construction discipline.
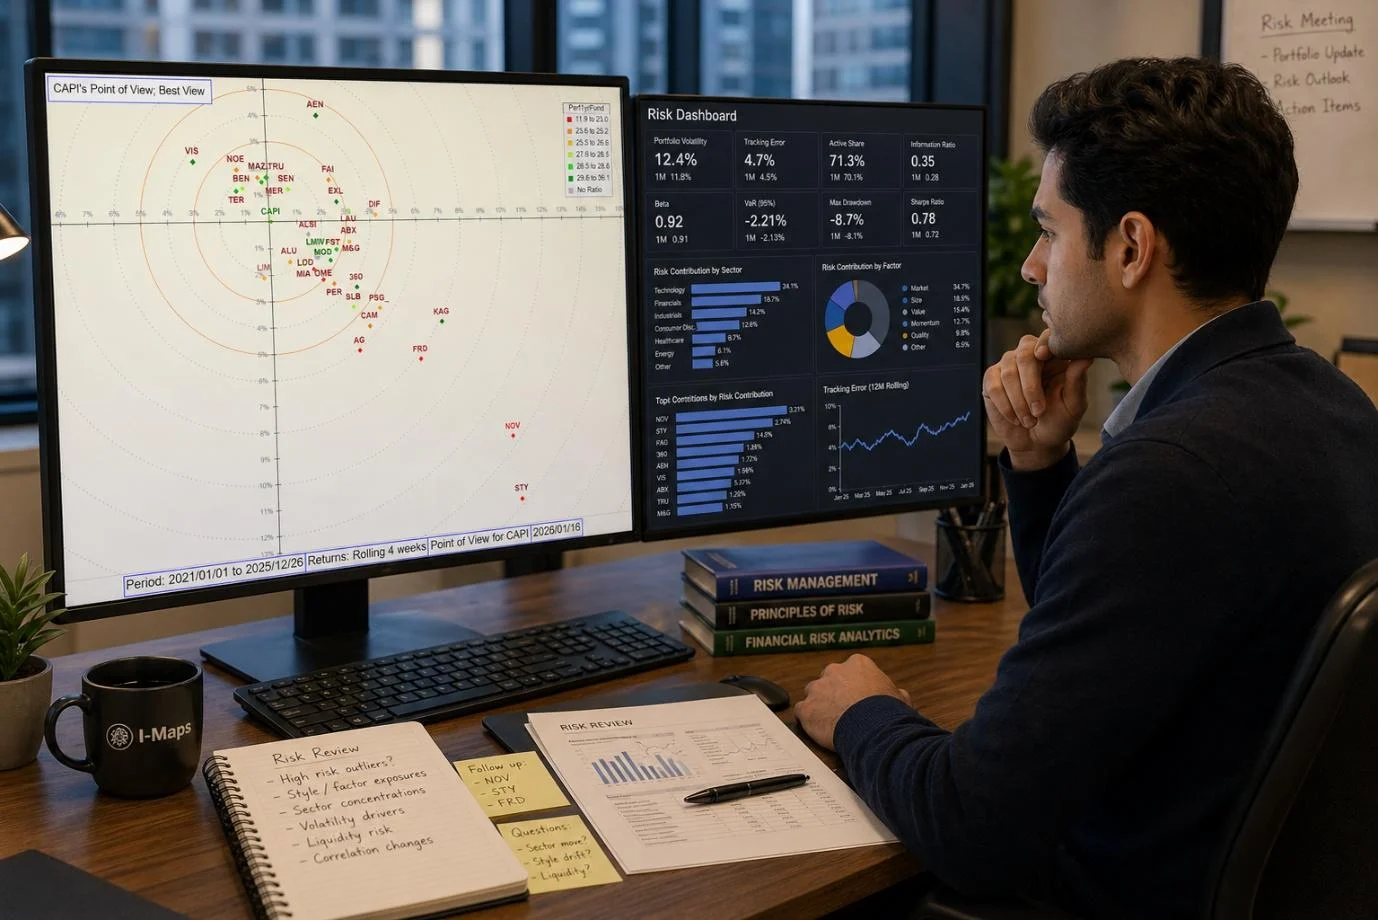
Gain deeper insight into portfolio risk drivers and historical behaviour through a combination of maps, analytics, and factor tools. Risk analysts can use I-Maps to monitor changes over time, quantify exposure shifts, and produce repeatable reporting that supports oversight and governance.
  • Analyse factor sensitivities and risk contributions to understand key drivers of tracking error and volatility.
  • Automate risk reporting and customise analysis for different mandates, teams, and reporting cycles.
  • Use historical tools for robust research, back-testing, and portfolio behaviour review across market periods.

Communicate complex portfolio information clearly and confidently through intuitive visual storytelling. I-Maps helps client-facing teams present positioning, explain performance drivers, and differentiate portfolios in a way that makes investment concepts easier to understand for non-specialist audiences.

half-circle

Multi-Managers

Gain a unified view of underlying portfolios to compare, combine, and monitor strategies across managers and on a look-through basis. By visualising multiple portfolios together, multi-manager teams can identify overlaps, crowding, and unintended exposures.
Portfolio architecture teams use I-Maps to compare blended strategies, reconcile holdings, and validate diversification across underlying managers. The platform supports a structured approach to building multi-sleeve portfolios and ensuring that the combined outcome aligns with overall objectives.
  • Compare blended strategies side-by-side to understand differences in positioning and risk structure.
  • Integrate and reconcile holdings across managers to improve transparency and reduce data friction.
  • Identify overlapping exposures and ensure diversification by spotting crowding and concentration early.
Due Diligence analysts use I-Maps to compare underlying managers in their portfolio, evaluate track records, and model the impact of manager changes within multi-manager structures. By pairing visual positioning with analytical context, analysts can understand how different approaches behave over time and how they influence portfolio outcomes.
  • Compare managers’ track records with structured visual and historical reporting outputs.
  • Track risk contributions within multi-manager structures to understand who is driving portfolio risk.
  • Model the impact of manager changes to assess diversification outcomes before making allocation decisions.

Fund Consultants

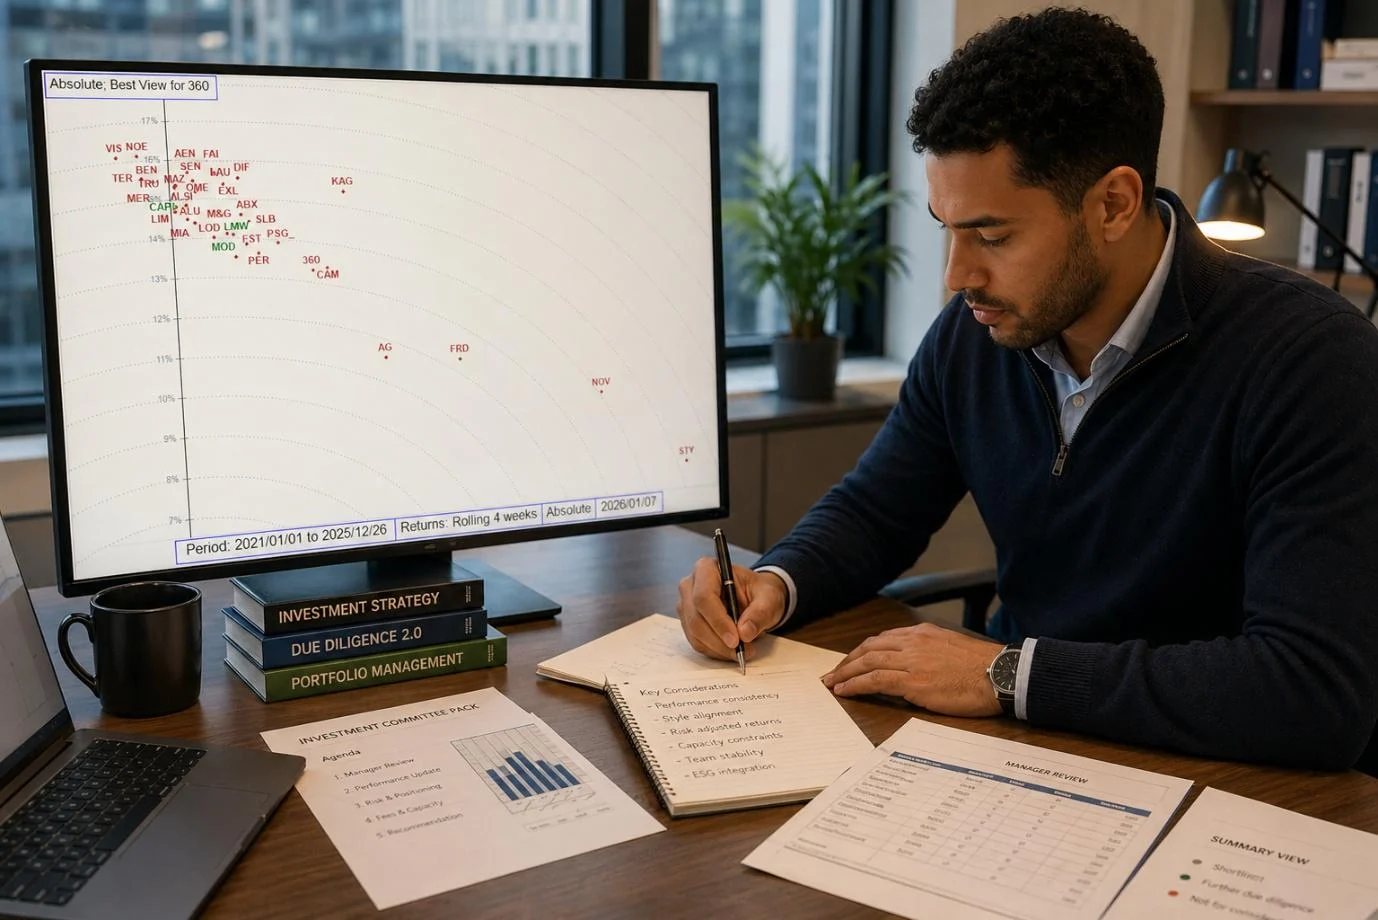
Analyse, compare, and present funds with greater clarity, consistency, and impact. Fund consultants can use I-Maps to strengthen due diligence, support peer comparisons, and present outcomes in a way that is easier for decision-makers to interpret and act on.

Run peer comparisons and clearly communicate relative strengths and risks. I-Maps helps consultant teams build consistent narratives across multiple funds by making differences in positioning, structure, and risk drivers easier to see and explain.
  • Run side-by-side comparisons across multiple peers with consistent visual outputs.
  • Visualise each fund’s unique characteristics through map positions and supporting analytics.
  • Identify strengths, risks, and positioning trends across manager universes and time periods.
Produce in-depth analysis supported by clear visuals and evidence-based insights. I-Maps supports research teams by combining structured analytics with visual context, helping uncover trends, validate strategies, and communicate findings more clearly.
  • Deliver deep-dive analysis supported by visual explanation and robust evidence.
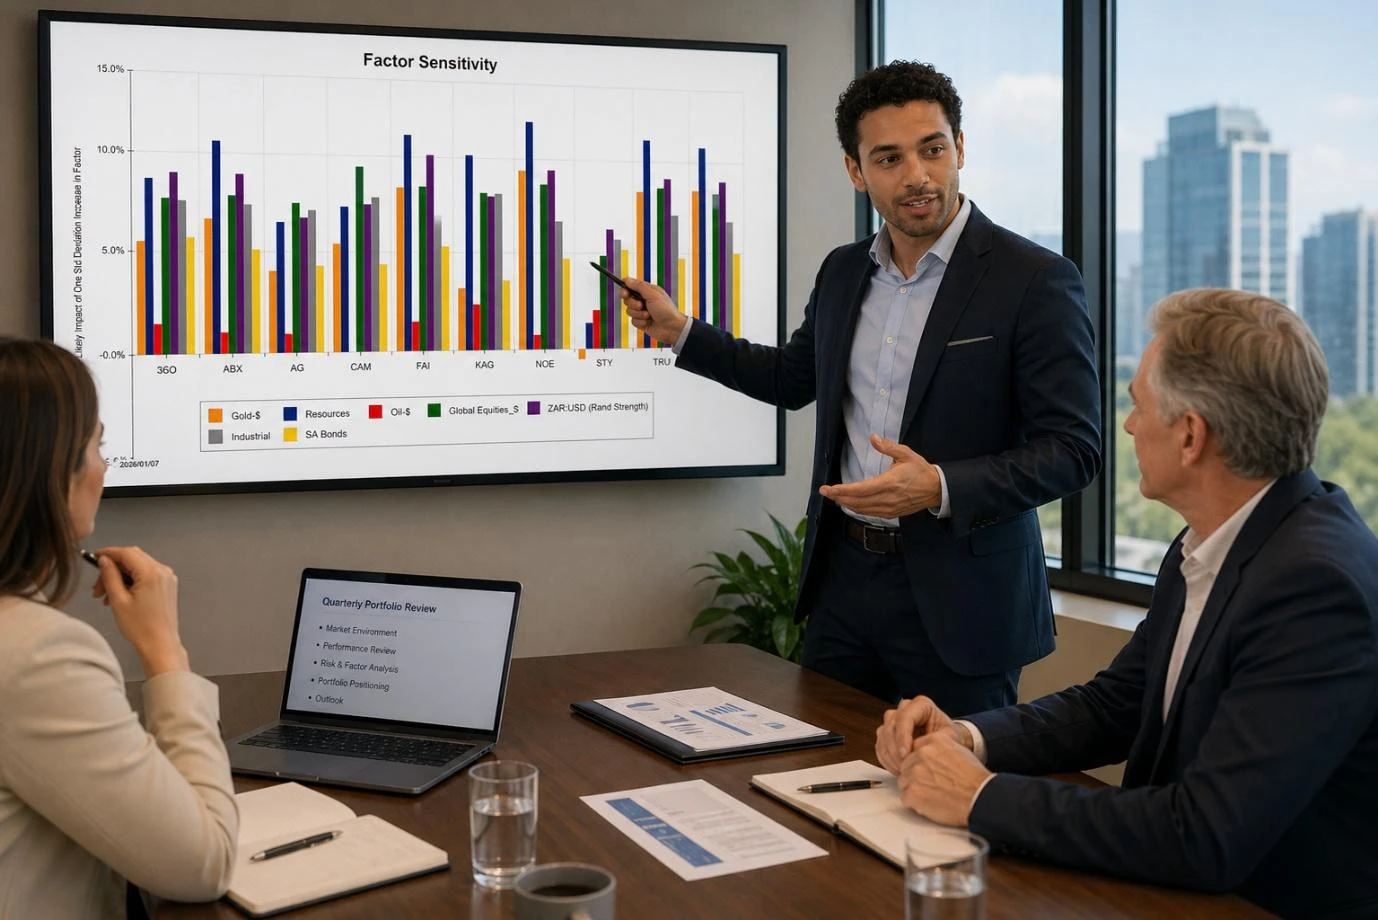
  • Use factor-sensitivity charts and historical views to illustrate risk profiles and behaviour.
  • Combine data and visuals to create clear narratives that support research conclusions and recommendations.
Enhance client presentations with intuitive visuals and meaningful portfolio insights. With I-Maps, teams can explain portfolio structure, active positioning, and risk drivers more effectively, helping clients understand decisions and remain aligned through different market environments.
  • Integrate automatable intuitive visuals into client reports and presentations for faster understanding.
  • Help audiences quickly interpret complex portfolio stories without technical overload.
  • Highlight differentiators and performance drivers with clear positioning and risk context.

Visualise the investment environment and take control—position your portfolio with confidence using our dynamic platform.